


Trend lines are one of the most basic, yet essential, technical analysis tools used by traders. Trend lines help identify areas of support and resistance and can help determine when trends change direction. Here is an in-depth look at how to properly draw and utilize trend lines.
What are Trend Lines?
Trend lines connect either a series of highs or lows on a price chart. Upward sloping trend lines connect areas of support while downward sloping trend lines connect areas of resistance. The angles and steepness of the trend lines illustrate the strength and direction of the trend.
How to Draw Trend Lines
Drawing accurate trend lines is a critical technical analysis skill. Follow these rules:
- Connect at least 2 pivot highs or lows, and preferably 3 or more. The more touches, the stronger the line.
- Extend the line out to future bars on the chart. It can extend indefinitely.
- Draw the straightest line possible that connects the pivot points. Don’t curve-fit lines.
- Adjust angled trend lines at key breaks rather than drawing new lines.
Pay attention to whether critical pivot points fall precisely on the trend line, or deviate slightly above or below. Accuracy indicates strength.
Uptrend Lines and Downtrend Lines
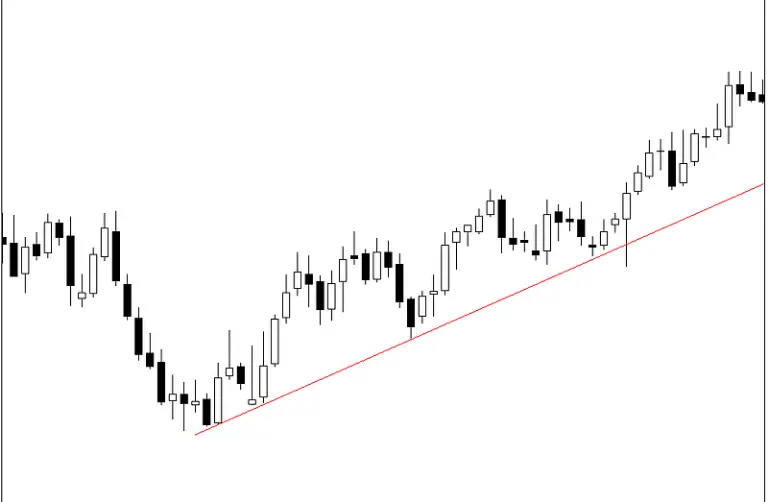
Uptrend lines connect consecutive low pivot points as they rise over time. This forms a support line where buyers tend to enter repeatedly.
Downtrend lines connect descending high pivots representing resistance on bounces. Sellers emerge around resistance trend lines, sending price lower again.
The angle and timeframe determine the implications. Steep trend lines show rapid changes in sentiment. Long, gently-sloped lines reflect persistence of a longer-term trend.
Signals and Strategies
Trend line breaks, tests, and crossovers generate trading signals and opportunities:
- Breaks – When price penetrates a trend line, it signals potential trend weakness or reversal.
- Tests – When price approaches a trend line, it may offer low-risk entry points for existing trends.
- Crossovers – When a faster moving average crosses below or above a slower one, it signals shifting momentum.
Use trend line breaks to confirm reversals. Look to buy tests of support in uptrends, or short tests of resistance in downtrends. Focus on high volume penetrations.
Limitations of Trend Lines
While invaluable, trend lines do have some limitations:
- Subjectivity – Placements involve some subjectivity and interpretation.
- Curve fitting – Avoid arbitrarily forcing lines to fit.
- Lagging – They are based on past data and thus lag current price action.
- Breakdown zones – Small penetrations don’t necessarily invalidate a line.
Use trend lines in conjunction with other indicators like moving averages and volume for confirmation. No single tool stands alone.
Read More: How Much Does it Cost to Buy, Maintain and Rent a Private Jet?
Trend Channel Lines
Another variation is drawing parallel lines containing the price swings within uptrends and downtrends. These trend channel lines contain prices within the trending range. Traders buy near the lower channel line and sell near the upper line.
Channels help identify overextended moves signaling impending reversals back inside the channel. Price hitting channel lines offers trading opportunities.
Best Practices
When using trend lines:
- Wait for a line to be tested before acting on signals.
- Combine with supporting indicators like higher highs/lows and trading volume.
- Factor in time frames, looking at both short and longer-term trends.
- Set stops beyond your trend lines to avoid being stopped out prematurely.
Ongoing practice is required to master trend line analysis. But their insights into trend strength and direction make them foundational technical analysis skills. Combine trend lines with robust risk management for high-probability trading.
Frequently Asked Questions (FAQs) about Trend Lines:
1. How do I determine the validity of a trend line?
The validity of a trend line depends on the number of touchpoints. The more times prices respect the trend line by bouncing off it, the more valid the trend line is considered.
2. Can trend lines be applied to various financial markets?
Yes, trend lines are versatile and can be applied to various markets, including stocks, forex, commodities, and cryptocurrencies. The principles of trend lines remain consistent across different financial instruments.
3. What is the significance of trend line angles?
Steeper trend lines may indicate a more aggressive trend, but they can also be prone to sharper reversals. Shallower angles suggest a more sustainable and gradual trend.
4. How often should I update trend lines?
The frequency of updating trend lines depends on the timeframe of the chart. For short-term traders, updating trend lines more frequently may be necessary, while long-term investors may review trend lines less frequently.
5. Can trend lines be used in isolation for trading decisions?
While trend lines provide valuable insights, they are most effective when used in conjunction with other technical indicators and analysis tools. Combining multiple sources of information enhances the robustness of trading decisions.
Conclusion
Trend lines condense price action into easily identifiable support and resistance zones. When drawn properly on charts, they help structure trading strategies around the forces of buying and selling pressure. Trend lines provide an essential visual tool for traders across markets and time frames.
Also Read: What is a Portfolio?


